In today’s fast-paced business world, measuring and analyzing performance is more important than ever. Management thinker Peter Drucker famously said, "What’s measured, improves." This idea has prompted many entrepreneurs to use performance measurement tools, with dashboards standing out as one of the most effective options. Dashboards visually represent key performance indicators (KPIs), enabling business owners to make informed decisions swiftly. This post will explore how to use dashboards to enhance performance, their operational benefits, and practical strategies for selecting the right KPIs.
Understanding Dashboards
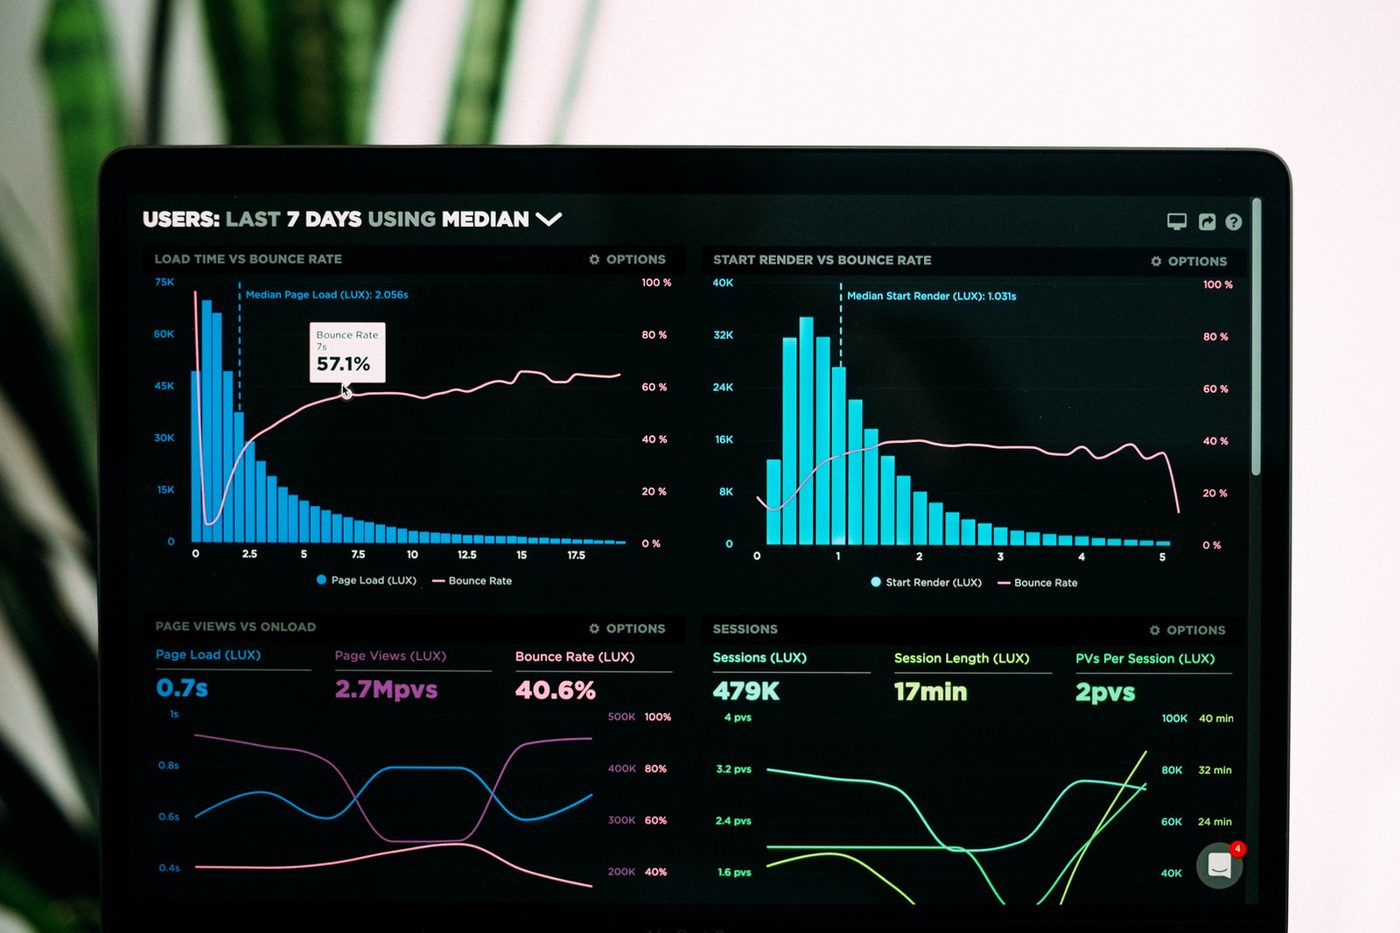
Dashboards act as visual displays that gather and show data from various sources within a single interface. Users can monitor performance metrics in real time, making it easier to detect trends, follow progress, and make informed decisions.
Dashboards can be tailored to a business's specific needs, providing insights into various areas such as sales, customer satisfaction, operational efficiency, and financial performance. By simplifying complex data, dashboards empower entrepreneurs to concentrate on what matters most.
The Benefits of Dashboards for Operations
Incorporating dashboards into business operations provides several advantages. Here are some key benefits:
1. Enhanced Decision-Making
Real-time data accessible via dashboards allows business leaders to make quick, informed decisions. For instance, if a retail store notices a sudden spike in online sales of a specific product by 25% over a week, they can promptly restock to meet demand.
2. Improved Accountability
Dashboards promote accountability by clearly showing performance metrics. When team members can see their impact on key goals, they are more likely to take ownership. For example, a team member observing their individual sales performance against the monthly target can drive them to make more calls or follow up on leads.
3. Increased Efficiency
By compiling data from multiple sources, dashboards greatly simplify the reporting process. For example, managers no longer need to spend weeks compiling monthly reports; instead, they can review key metrics in minutes. This efficiency allows teams to focus on analysis and strategy, rather than data collection.
4. Better Communication
Dashboards improve communication within teams and across departments. By providing a shared visual reference, they ensure everyone understands performance goals. For instance, a marketing team can easily see how well their campaigns are performing compared to sales, aiding coordination between departments.
5. Identification of Trends and Patterns
Dashboards allow users to detect trends and patterns in their data over time. For example, a restaurant may notice a consistent dip in customer satisfaction ratings during weekends. This insight can prompt management to investigate staffing levels and training needs during peak hours.
Choosing the Right KPIs for Your Dashboard
Selecting the most relevant KPIs is vital for maximizing your dashboard's effectiveness. Here are helpful tips:
1. Align KPIs with Business Goals
Ensure your KPIs match your overall business objectives. This alignment is necessary to track progress effectively. For example, if your goal is to increase customer retention, focus on metrics such as churn rate or repeat purchase rate.
2. Focus on Actionable Metrics
Identify KPIs that offer actionable insights. For example, instead of just monitoring website traffic, track conversion rates to understand how well your site is turning visitors into customers.
3. Limit the Number of KPIs
Try to avoid overwhelming users by limiting the number of KPIs on your dashboard. A focused dashboard with roughly 5 to 10 key metrics can provide clarity while still offering comprehensive insights.
4. Involve Stakeholders in the Selection Process
Bring team members and stakeholders into the KPI selection process. Their diverse perspectives can help ensure the chosen metrics genuinely reflect the needs of the organization.
5. Regularly Review and Update KPIs
As your business grows, your KPIs should evolve too. Regularly revisiting and updating your metrics guarantees they remain relevant and aligned with your objectives.
Examples of Business Dashboards
Below are examples of how various industries can tailor dashboards to their needs:
1. Sales Dashboard
A sales dashboard can highlight essential metrics like total sales, conversion rates, and sales by product category. For instance, if you notice that a particular product line accounts for 40% of total sales, you can strategize around its promotion.
2. Marketing Dashboard
A marketing dashboard tracks campaign performance, such as click-through rates and social media engagement. When a campaign suddenly sees a 50% increase in website traffic, the team can analyze what drove that success and replicate it.
3. Financial Dashboard
A financial dashboard presents critical metrics like revenue growth, operating expenses, and profit margins. For instance, by monitoring expenses, a business can quickly identify areas to cut costs, ensuring financial stability during challenging times.
4. Operations Dashboard
An operations dashboard offers insights into production efficiency and inventory levels. If a factory dashboard shows that one line is producing 20% less than expected, this signals a need for further investigation.
5. Customer Service Dashboard
Customer service dashboards can track response times and customer satisfaction scores. If the average response time increases by 30%, management can address staffing needs or customer service processes to improve satisfaction.
Implementing Dashboards in Your Business
With an understanding of dashboard benefits and KPIs, it’s time for implementation. Here are steps to follow:
1. Define Your Objectives
Clearly specify what you want to achieve with your dashboard. For example, if your goal is to improve customer satisfaction, your dashboard should focus on relevant KPIs related to service quality.
2. Select the Right Dashboard Tool
Choose a dashboard tool that fits your business needs. Options range from basic spreadsheet systems to advanced business intelligence platforms. Prioritize user-friendliness, integration possibilities, and customization features.
3. Design Your Dashboard
Think about user experience when designing your dashboard. Make it visually appealing and easy to navigate. Use charts and graphs, as these can make complex data easier to understand.
4. Train Your Team
Provide comprehensive training on how to use the dashboard effectively. This training will ensure everyone knows how to interpret the data and leverage it for better decision-making.
5. Monitor and Adjust
After deploying your dashboard, continually assess its effectiveness. Gather user feedback and be ready to make changes to improve usability and relevance.
Best Practices for Dashboard Management
To get the most out of your dashboards, consider these best practices:
1. Keep It Simple
Simplicity is essential in dashboard design. A straightforward layout helps users focus on critical information without distractions.
2. Use Visualizations Wisely
Select appropriate visualizations like line graphs or pie charts to clarify the data you present. Choosing the right format enhances comprehension.
3. Ensure Data Accuracy
Reliable data sources are essential for sound decision-making. Regularly verify that your data inputs are accurate to maintain credibility.
4. Foster a Data-Driven Culture
Encourage a culture of making data-driven decisions. Promote dashboards as tools for empowering team members to take informed actions.
5. Stay Flexible
Be willing to adapt your dashboard as your business evolves. Routinely review and adjust your KPIs and metrics to ensure they fit current operations.
Final Thoughts
Dashboards are powerful tools that can significantly enhance performance for entrepreneurs and business leaders. Measuring and visualizing key performance indicators enable informed decision-making, promote accountability, and boost operational efficiency.
By choosing the right KPIs, implementing effective strategies, and fostering a data-driven culture, you can harness the full potential of dashboards. Embrace the idea that "what's measured improves," and you can unlock new levels of success while ensuring your business thrives in a competitive landscape.